

Tesla (TSLA) – Get Free Report stock has been buried, as it’s fallen in eight of the last nine trading sessions and has made new 52-week lows in eight consecutive sessions.
Further, shares are now down in five straight months, highlighted by December’s current decline of 33.7%. From the all-time high, Tesla stock is now down 69.2%.
Some blame Tesla’s decline solely on the bear market. Others blame CEO Elon Musk continuing to sell Tesla stock as the true culprit. Musk’s also been distracted from Tesla since taking the CEO role at Twitter.
The reality is, it could be a bit of all factors at play. However, the predominant theme here is a rising-rate environment and an oncoming recession.
Why would investors park their money in a company like Tesla when they could generate a risk-free return in Treasury bonds? Further, with a recession bearing down on the economy, who wants to be in an automaker?
This thought process can help explain why Tesla stock has been nearly “bid-less” over the last few weeks and months.
Trading Tesla Stock

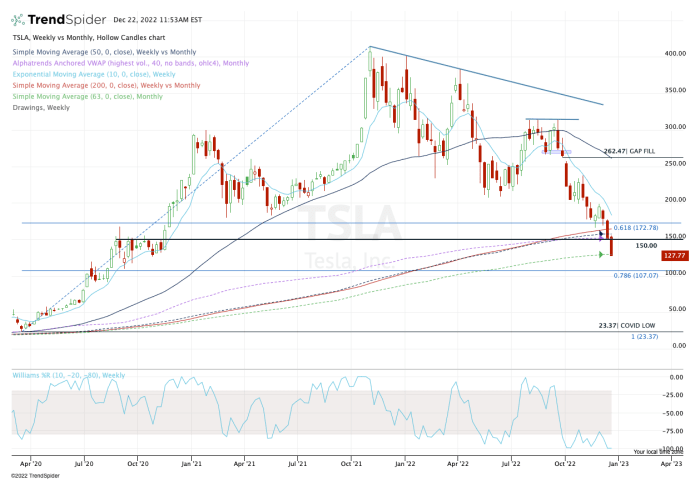
Weekly chart of Tesla stock.
Chart courtesy of TrendSpider.com
This is a lesson in what I call “deliberate price action.”
Tesla stock deliberately broke below a major area on the chart when it had the potential to hold this zone. That area was $150.
Not only was it a major breakout area from 2020, but it also marked the 200-week and 50-month moving averages, as well as the monthly VWAP measure.
Not holding this level makes a loud statement; a deliberate statement. In this case, it says that the sellers are in control.
Traders who were buyers in the $150 to $160 range were right to do so.
Yes, you read that right. Buying in that zone was the proper move, as the risk/reward was skewed to the upside. More importantly, the risk was contained to a break of $150.
Put another way: Just because the trade did not work out does not mean it was the wrong trade. Remember, traders work with probabilities, not certainties.
The $150 area was a high-probability setup given the number of potential support measures in the place. However, it was not a zone of absolute certainty (no level is).
As for current measures, keep an eye on the $125 to $130 area, as that’s where the 21-quarter moving average comes into play. A break of that zone opens the door to the $100 to $110 zone.
In that area, we find another breakout area and the 78.6% retracement from the all-time high down to the covid 2020 low.
On the upside, I am looking at the $150 to $160 area to be resistance until the stock is able to prove otherwise by reclaiming it. That’s right, prior support is now likely to be current resistance.
[ad_2]
Share this news on your Fb,Twitter and Whatsapp
Times News Network:Latest News Headlines
Times News Network||Health||
