Bulls may be losing enthusiasm for stocks, but these 3 potential takeover plays could land in the money

The U.S. stock market, as measured by the S&P 500 Index
SPX,
had finally broken out over triple resistance at 4100, on Feb. 1. But the S&P 500 has had trouble adding to that breakout. Instead, the market has pulled back and retested what is now support at 4100 numerous times this week. So far, that support has held, but some overbought conditions and even sell signals have had time to manifest themselves while SPX stalls in this area.
If the support at 4100 were to give way, that would be a psychologically disappointing event, and it would probably propel SPX down towards the lower end of its previous trade range — near 3800. On the upside, the initial breakout reached 4200, which was equal to the late August levels. SPX has not closed the gap on its chart from that August time period (circle on the accompanying SPX chart).
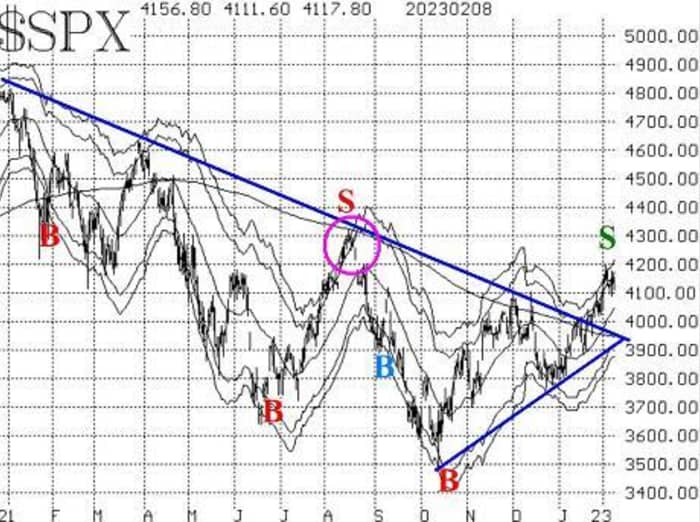
The rally did manage to exceed the +4σ “modified Bollinger Band (mBB).” Then, when SPX fell back below the +3σ Band, a “classic” mBB sell signal was generated. Since SPX then fell further the next day, a full-fledged McMillan Volatility Band (MVB) sell signal has been confirmed (green “S” on the chart). This will remain in effect until SPX either a) touches the -4σ Band, which is the “target,” or b) closes back above the +4σ Band, which would stop out the trade.
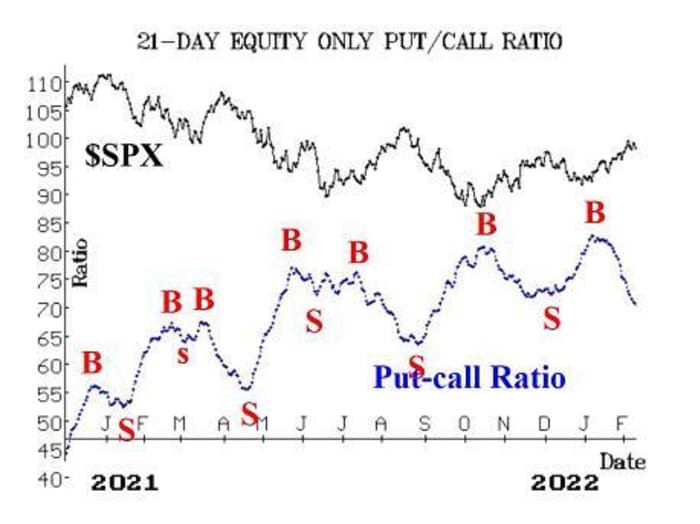
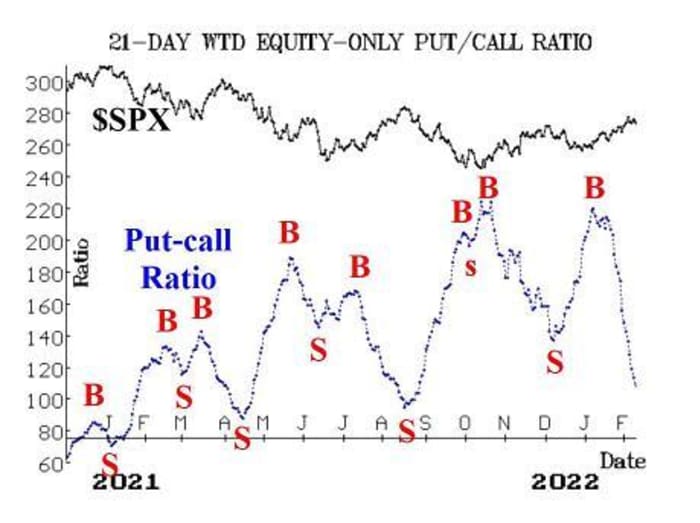
Equity-only put-call ratios continue to decline at a rapid pace. Thus, they are still both on buy signals. They have now fallen to levels near where sell signals were generated last year. But we don’t use previous levels as indicators for these put-call ratios. Rather, they will remain bullish for stocks as long as they continue to decline — no matter how low they get on their charts. They will not generate sell signals until they roll over and begin to rise.
Breadth had been spectacular for over a month. But this latest back-and-forth action by the market, with several sharp down days, has taken its toll. Currently, both breadth oscillators are still on buy signals, but they have run out of “wiggle” room. That is, any further negative accumulation of breadth from today forward will generate sell signals from the breadth oscillators.
New 52-week highs on the NYSE continue to be strong (they reached more than 200 on one recent day), while new 52-week lows remain in single digits. So, this indicator remains positive for stocks. It will continue to do be bullish unless new lows outnumber new highs for two consecutive days, on the NYSE.
The volatility complex generally remains bullish for the stock market as well. VIX
VIX,
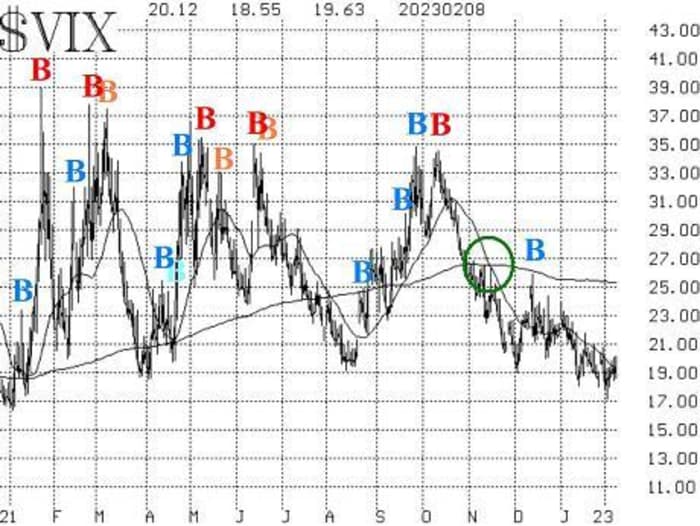
has stayed at low levels, despite some relatively heavy selling on occasion by SPX. Thus, the trend of VIX buy signal remains in effect (it began at the crossover inside the green circle on the accompanying VIX chart). The first signs of worry would be if VIX were to re-enter “spiking” mode — that is, if it were to close at least 3.00 points higher over any 1-, 2-, or 3-day period. Currently, VIX would have to close above 21.48 today or Friday in order to re-enter “spiking” mode. It has not shown any recent signs of such an upward move, though.
The construct of volatility derivatives is also bullish for stocks – for the most part. The only “worry” in the construct is that the CBOE short-term 9-day Volatility Index (VIX9D) is higher than VIX. That’s because the CPI figures are due to be released this month on February 14th, and that is within the 9-day “window” for VIX9D. Traders are expecting the CPI figure to introduce some (more) volatility into stock prices.
We are no longer carrying a “core” bearish position since SPX has risen above its bear market downtrend line. We will trade from both the long and short sides, though, as confirmed signals from our indicators dictate.
New Recommendation: MVB sell signal
Since a new MVB sell signal has been generated, we are going to add a position in line with that indicator:
Buy 1 SPY Mar (17th) at-the-money put
And Sell 1 SPY Mar (17th) put with a striking price 25 points lower.
This trade would be stopped out if SPX were to close back above the +4σ Band. We will keep you updated regarding the position of the Bands each week.
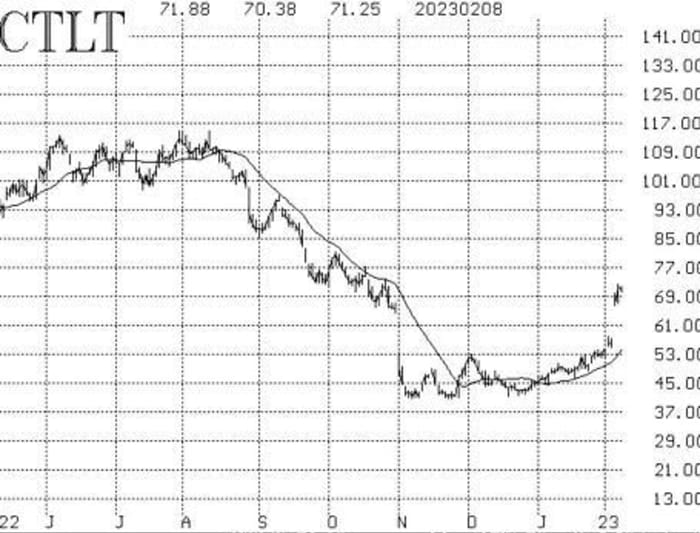
New Recommendation: Catalent Inc. (CTLT)
Option volume in Catalent
CTLT,
has remained at an elevated level for several days, after if first gapped higher on news of possible takeover by Danaher
DHR,
That rumor has slowed just a bit, but the stock is holding at levels above 70. Stock volume patterns are positive, and there are also put-call ratio buy signals in this stock. Because of price gaps, there is no visible support level until you get all the way back down to 58.
Buy 2 CTLT Mar (17th) 70 calls
At a price of 6 or less.
CTLT: 71.60 Mar (17th) 70 call: 5.50 bid, offered at 6.20
Follow-Up Action:
All stops are mental closing stops unless otherwise noted.
We are using a “standard” rolling procedure for our SPY spreads: in any vertical bull or bear spread, if the underlying hits the short strike, then roll the entire spread. That would be roll up in the case of a call bull spread, or roll down in the case of a bear put spread. Stay in the same expiration, and keep the distance between the strikes the same unless otherwise instructed.
Long 2 PCAR1 Feb (17th) 64.80 puts: Paccar
PCAR,
split 3-for-2 on Feb. 8. Thus, the “shares per option” were increased from $100 per share to $150 per share, and the striking price was reduced by two-thirds. Put-call ratio has rolled over after a strong earnings report from PCAR. The options are essentially worthless, so we will hold them to see if the stock can pull back some.
Long 2 OSH Feb (17th) 30 calls: Oak Street Health
OSH,
received a $39 takeover bid from CVS Health.
CVS,
The stock is trading well below that level, apparently due to antitrust concerns, so we are going to exit and take the profit. Do not sell your calls below parity.
Long 1 SPY Feb (24th) 412 call and Short 1 SPY Feb (24th) 426 call: This spread was bought when the breakout over 3940 by SPX was confirmed, at the close on January 12th. It was rolled up on Feb. 1, when SPY
SPY,
traded at 412.
Long 1 SPY Feb (17th) 404 call and Short 1 SPY Feb (17th) 419 call: This spread was bought in line with the “New Highs vs. New Lows” buy signals. It was rolled up on Jan. 26, when SPY traded at 404. Stop yourself out of this position if New Lows on the NYSE exceed New Highs for two consecutive days.
Long 4 NATI Feb (17th) 55 calls: Hold National Instruments
NATI,
without a stop initially, to see if a bidding war develops.
Long 1 SPY Mar (17th) 415 call and Short 1 SPY Mar (17th) 431 call: This trade was established as a “breakout trade” when SPX closed above 4100. Stop yourself out on a close below 4020 by SPX.
Long 3 XM Mar (17th) 15 calls: Continue to hold Qualtrics International
XM,
while the takeover rumors play out.
Send questions to: [email protected].
Lawrence G. McMillan is president of McMillan Analysis, a registered investment and commodity trading advisor. McMillan may hold positions in securities recommended in this report, both personally and in client accounts. He is an experienced trader and money manager and is the author of the best-selling book, Options as a Strategic Investment. www.optionstrategist.com
©McMillan Analysis Corporation is registered with the SEC as an investment advisor and with the CFTC as a commodity trading advisor. The information in this newsletter has been carefully compiled from sources believed to be reliable, but accuracy and completeness are not guaranteed. The officers or directors of McMillan Analysis Corporation, or accounts managed by such persons may have positions in the securities recommended in the advisory.
Share this news on your Fb,Twitter and Whatsapp
Times News Network:Latest News Headlines
Times News Network||Health||